MabSelect SuRe™ ELISA Kit Performance Summary
INTRODUCTION
The Protein A ELISA Kit (catalog number 9333-1) is intended for the detection and quantitation of residual MabSelect SuRe™ ligand. Our Protein A detection ELISA Kit has been developed for those customers who require a highly sensitive assay to measure small amounts of contaminating MabSelect SuRe™ ligand in antibody products. Testing for contamination occurs in several different phases of development and commercial manufacturing that may include:
- Process development for leaching characteristics of the resin under specific conditions
- Manufacturing, typically from eluted samples taken throughout several points in the purification process
- Finish product release to document process containment levels and lot-to- lot consistency
The following summary report contains performance data collected from the evaluation of the Protein A ELISA Kit in the presence of human Immunoglobulin G (hIgG). The data presented here demonstrates the Protein A ELISA Kit’s:
- Ability to detect the MabSelect SuRe™ ligand in the presence of up to 0.5 mg/ml hIgG in a PBS-T buffer
- Percent recovery (accuracy), inter and intra assay precision, limit of quantitation and limit of detection

RESULTS SUMMARY
MabSelect SuRe™ in the Presence of hIgG
The performance of the Protein A ELISA Kit was evaluated when detecting the MabSelect SuRe™ ligand in the presence of hIgG compared to a standard containing no hIgG. All spiked samples had a final hIgG concentration of 0.125 mg/ml (following final dilution into the assay plate). Each sample was prepared in replicates of 8 and three separate ELISAs were performed according to the kit’s standard protocol.
Data Handling
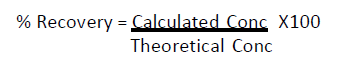
Standard curve data points were fitted to a 4-parameter fit analysis. This equation allowed back-calculation of sample rPA concentrations and calculation of LoQ values. Percent recovery was calculated as follows:
Intra-Assay Precision
Table 1. Intra-Assay Precision for Standard Curve samples
| Conc (ng/ml) | Avg % CV |
|---|---|
| 1.6 | 5.1 |
| 0.8 | 2.3 |
| 0.4 | 3.3 |
| 0.2 | 4.0 |
| 0.1 | 5.2 |
| 0.05 | 7.5 |
Table 2. Intra-Assay Precision for samples containing hlgG
| Conc (ng/ml) | Calculated Conc | Avg % CV |
|---|---|---|
| 1.2 | 1.25 | 6.1 |
| 1.0 | 1.01 | 5.3 |
| 0.8 | 0.76 | 4.1 |
| 0.6 | 0.64 | 4.9 |
| 0.4 | 0.37 | 5.4 |
| 0.2 | 0.18 | 7.7 |
| 0.1 | 0.09 | 11.0 |
| 0.05 | 0.05 | 18.0 |
Inter-Assay Precision
Table 3. Inter-Assay Precision for Standard Curve samples
| Conc (ng/ml) | Avg % CV |
|---|---|
| 1.6 | 0.1 |
| 0.8 | 0.2 |
| 0.4 | 0.8 |
| 0.2 | 1.6 |
| 0.1 | 2.1 |
| 0.05 | 2.7 |
Table 4. Inter-Assay Precision for sample containing hlgG
| Conc (ng/ml) | Calculated Conc | Avg % CV |
|---|---|---|
| 1.2 | 1.25 | 7.6 |
| 1.0 | 1.01 | 0.9 |
| 0.8 | 0.76 | 2.6 |
| 0.6 | 0.64 | 8.6 |
| 0.4 | 0.37 | 6.3 |
| 0.2 | 0.18 | 13.0 |
| 0.1 | 0.09 | 10.4 |
| 0.05 | 0.05 | 9.0 |
Accuracy
Table 5. Accuracy for Standard Curve samples
| Conc (ng/ml) | Avg % Error | Avg % Recovery |
|---|---|---|
| 1.6 | 0.0 | 100 |
| 0.8 | 0.4 | 100 |
| 0.4 | -0.7 | 99 |
| 0.2 | -1.3 | 99 |
| 0.1 | 2.1 | 102 |
| 0.05 | 7.3 | 107 |
Table 6. Accuracy for samples containing hlgG
| Conc (ng/ml) | Calculated Conc |
Avg % Error | Avg % Recovery |
|---|---|---|---|
| 1.2 | 1.25 | 3.8 | 104 |
| 1.0 | 1.01 | 1.2 | 101 |
| 0.8 | 0.76 | -4.5 | 96 |
| 0.6 | 0.64 | 5.9 | 106 |
| 0.4 | 0.37 | -8.2 | 92 |
| 0.2 | 0.18 | -8.0 | 92 |
| 0.1 | 0.09 | -8.8 | 91 |
| 0.05 | 0.05 | -7.8 | 92 |
Limit of Quanitation (LoQ)
The LoQ determined from the standard curve was calculated to be 0.025 ng/ml. The LOQ for the MabSelect SuRe™ ligand spiked samples in the presence of hIgG was 0.115 ng/ml or 0.920 ng/mg (0.92 ppm). Based on this data set the sensitivity of the kit when detecting MabSelect SuRe™ ligand in the presence of immunoglobulin is < 1 part per million (ppm).
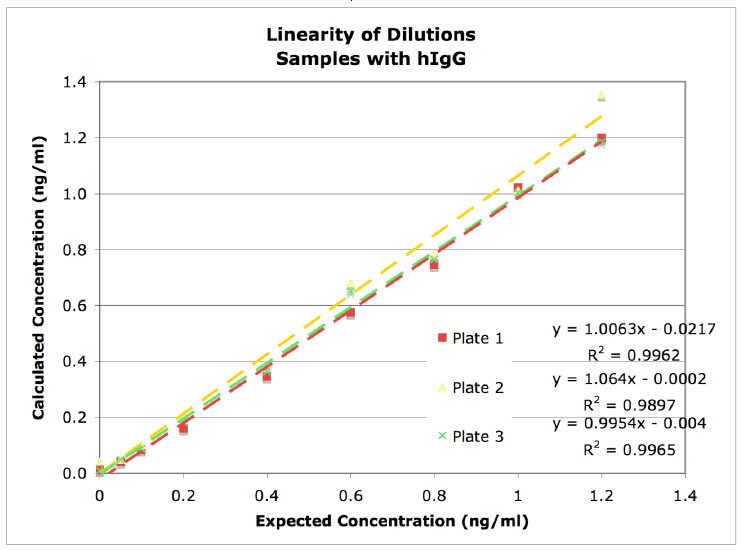
Linearity of Dilution
Figure 1. Linearity of dilution graph showing high correlation of accuracy throughout the range of MabSelect SuRe™ ligand concentrations tested.
CONCLUSIONS
Intra-assay data indicated that precision of the three assays was within acceptable parameters, with % CV values of the standards ranging from 2.3-7.5 %. This set of experiments had a standard LoQ of 0.025 ng/ml.
Intra-assay data indicated that samples containing hIgG were assayed with relative accuracy and precision, with % CV values from 11.0-4.1%. The LoQ calculated for the samples was 0.115 ng/ml. Accuracy, gauged by % relative error, was from 7.3 to -1.3 for standards, and from -8.8 to 5.9 for samples.
Inter-assay data had similar findings. The % CV between standard curve samples was less than 2.7 for all concentrations, indication of precision across the three assays. The samples containing hIgG had a high degree of precision as well with % CV values in the range of 13.0-0.9% for concentrations above the LoQ.
Explanation of calculations
Precision (%CV)
Precision was calculated by determining the standard deviation between rPA spiked sample data points and dividing by the mean value. According to the ‘Guidance for Industry: Bio-analytical Method Validation’ text, precision should be within 15%.
Intra-Assay Precision
The intra-assay precision was calculated for each rPA spiked sample concentration by averaging the %CV values across all assays.
Inter-Assay Precision
The inter-assay precision was calculated for each concentration point by determining the standard deviation between calculated results from each of the three assays, then dividing by the mean value.
Limit of Quantitation (LoQ)
The limit of quantitation (LoQ) was defined as 10 times the standard deviation of 0 ng/ml sample. The standard deviation of the 0 ng/ml OD value was multiplied by 10 then added to base 0 ng/ml OD value. The LoQ was then generated by entering the summed value into the standard curve 4-parameter fit equation. For each kit the LoQ was reported as ng Protein A per ml (ng/ml) buffer, and ng Protein A per mg hIgG (ppm) for rPA spiked samples run in presence of hIgG.
Limit of Detection (LoD)
The limit of detection (LoD) was defined as 3 times the standard deviation of 0 ng/ml Protein A
sample. The standard deviation of the 0 ng/ml OD value was multiplied by 3 then added to base 0 ng/ml OD value. The LoD was then generated by entering the summed value into the standard curve 4-parameter fit equation. For each kit a LoD was reported as ng Protein A per ml (ng/ml) buffer and in parts per million (ppm).
Accuracy
Accuracy is described as the % recovery determined by the assay compared to the theoretical spiked concentration.
MabSelect™, MabSelect SuRe™ and SuRe™ are registered trademarks of GE Healthcare.